KAMIKAMI EMA RIBBONGood evening plebians, This IS Cryptofilio, Your dark knight in the Crypto lightness.... Introducing yet another nebulous indicator... It's the KAMI, KAMI (GODS in Japanese) EMA ribbon.....
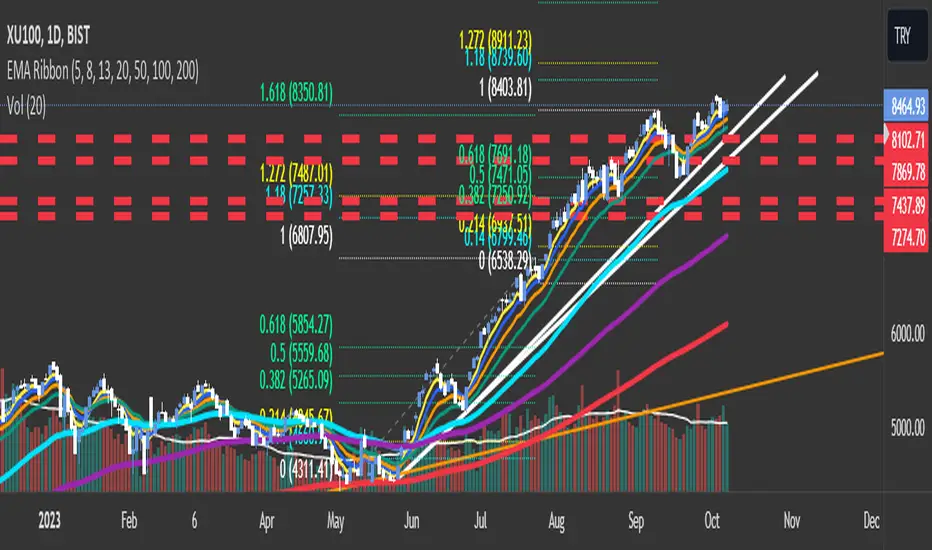
This indicator uses 3 primary lengths of EMA labeled as Short, Medium, and Long. They change colors in relation to each other and in relation to the current price of the security.
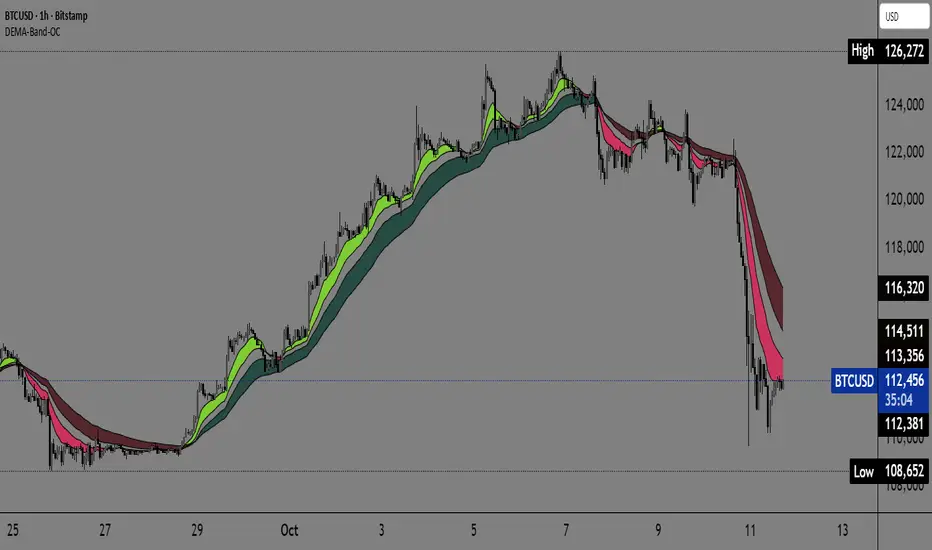
This indicator is more sophisticated than a simple MA cross strategy as you can use a wider variety of signals for entering earlier and exiting earlier, thus getting into a trade early in the run-up and getting out before the run-down. The EMA is identifiable by the color, lighter green and red representing lower lookbacks. When the OHLC4 crosses the ema it changes color. Thus if all colors are red, then the security is trading below all EMA's - a strong sell or short signal.
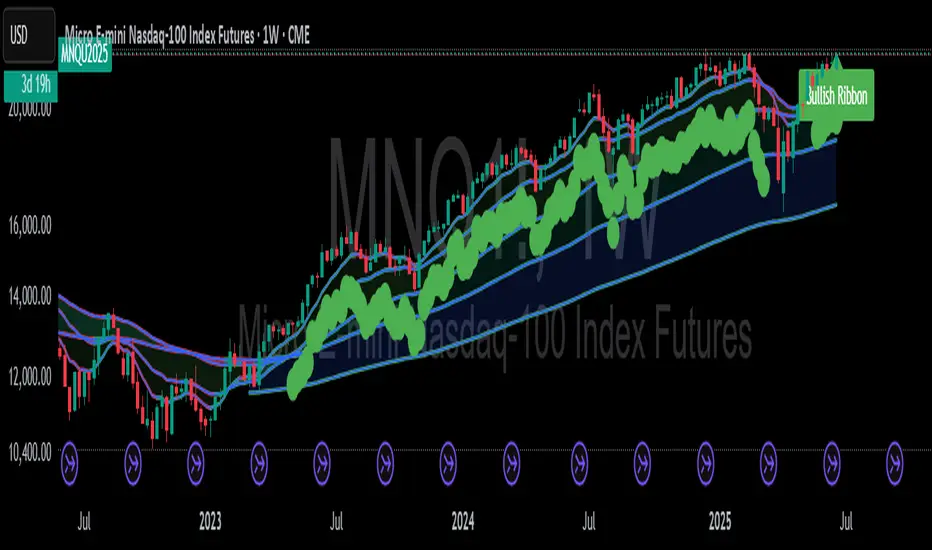
GREEN inside of RED indicates an uptrend within a larger downtrend... and of course, the inverse is also true.
The triangles which indicate a cross, are color-coded according to their significance by transparency - the less transparent the more important or significant the cross.
In addition, there are bull and bear bounce indicators (the arrows) that predict a bounce up or down from the security meeting a point along the EMA line and reacting.
VARIATIONS: To use this for scalping I suggest 5,8,13
Penunjuk Pine Script®